Hiring talent is critical for any business; find the right one and they will help you succeed. On the other hand, a bad hire is surely detrimental to any organization. According to the Bureau of Labor Statistics the summary of US wages -accross all typical jobs- are categorized below. (Anesthesiologists, surgeons, top managers at the highest end and cooks, cashiers, ‘artists’ towards the bottom).
##   Min. 1st Qu.  Median    Mean 3rd Qu.    Max.
##  21230   36675   50480   58887   72245  265990
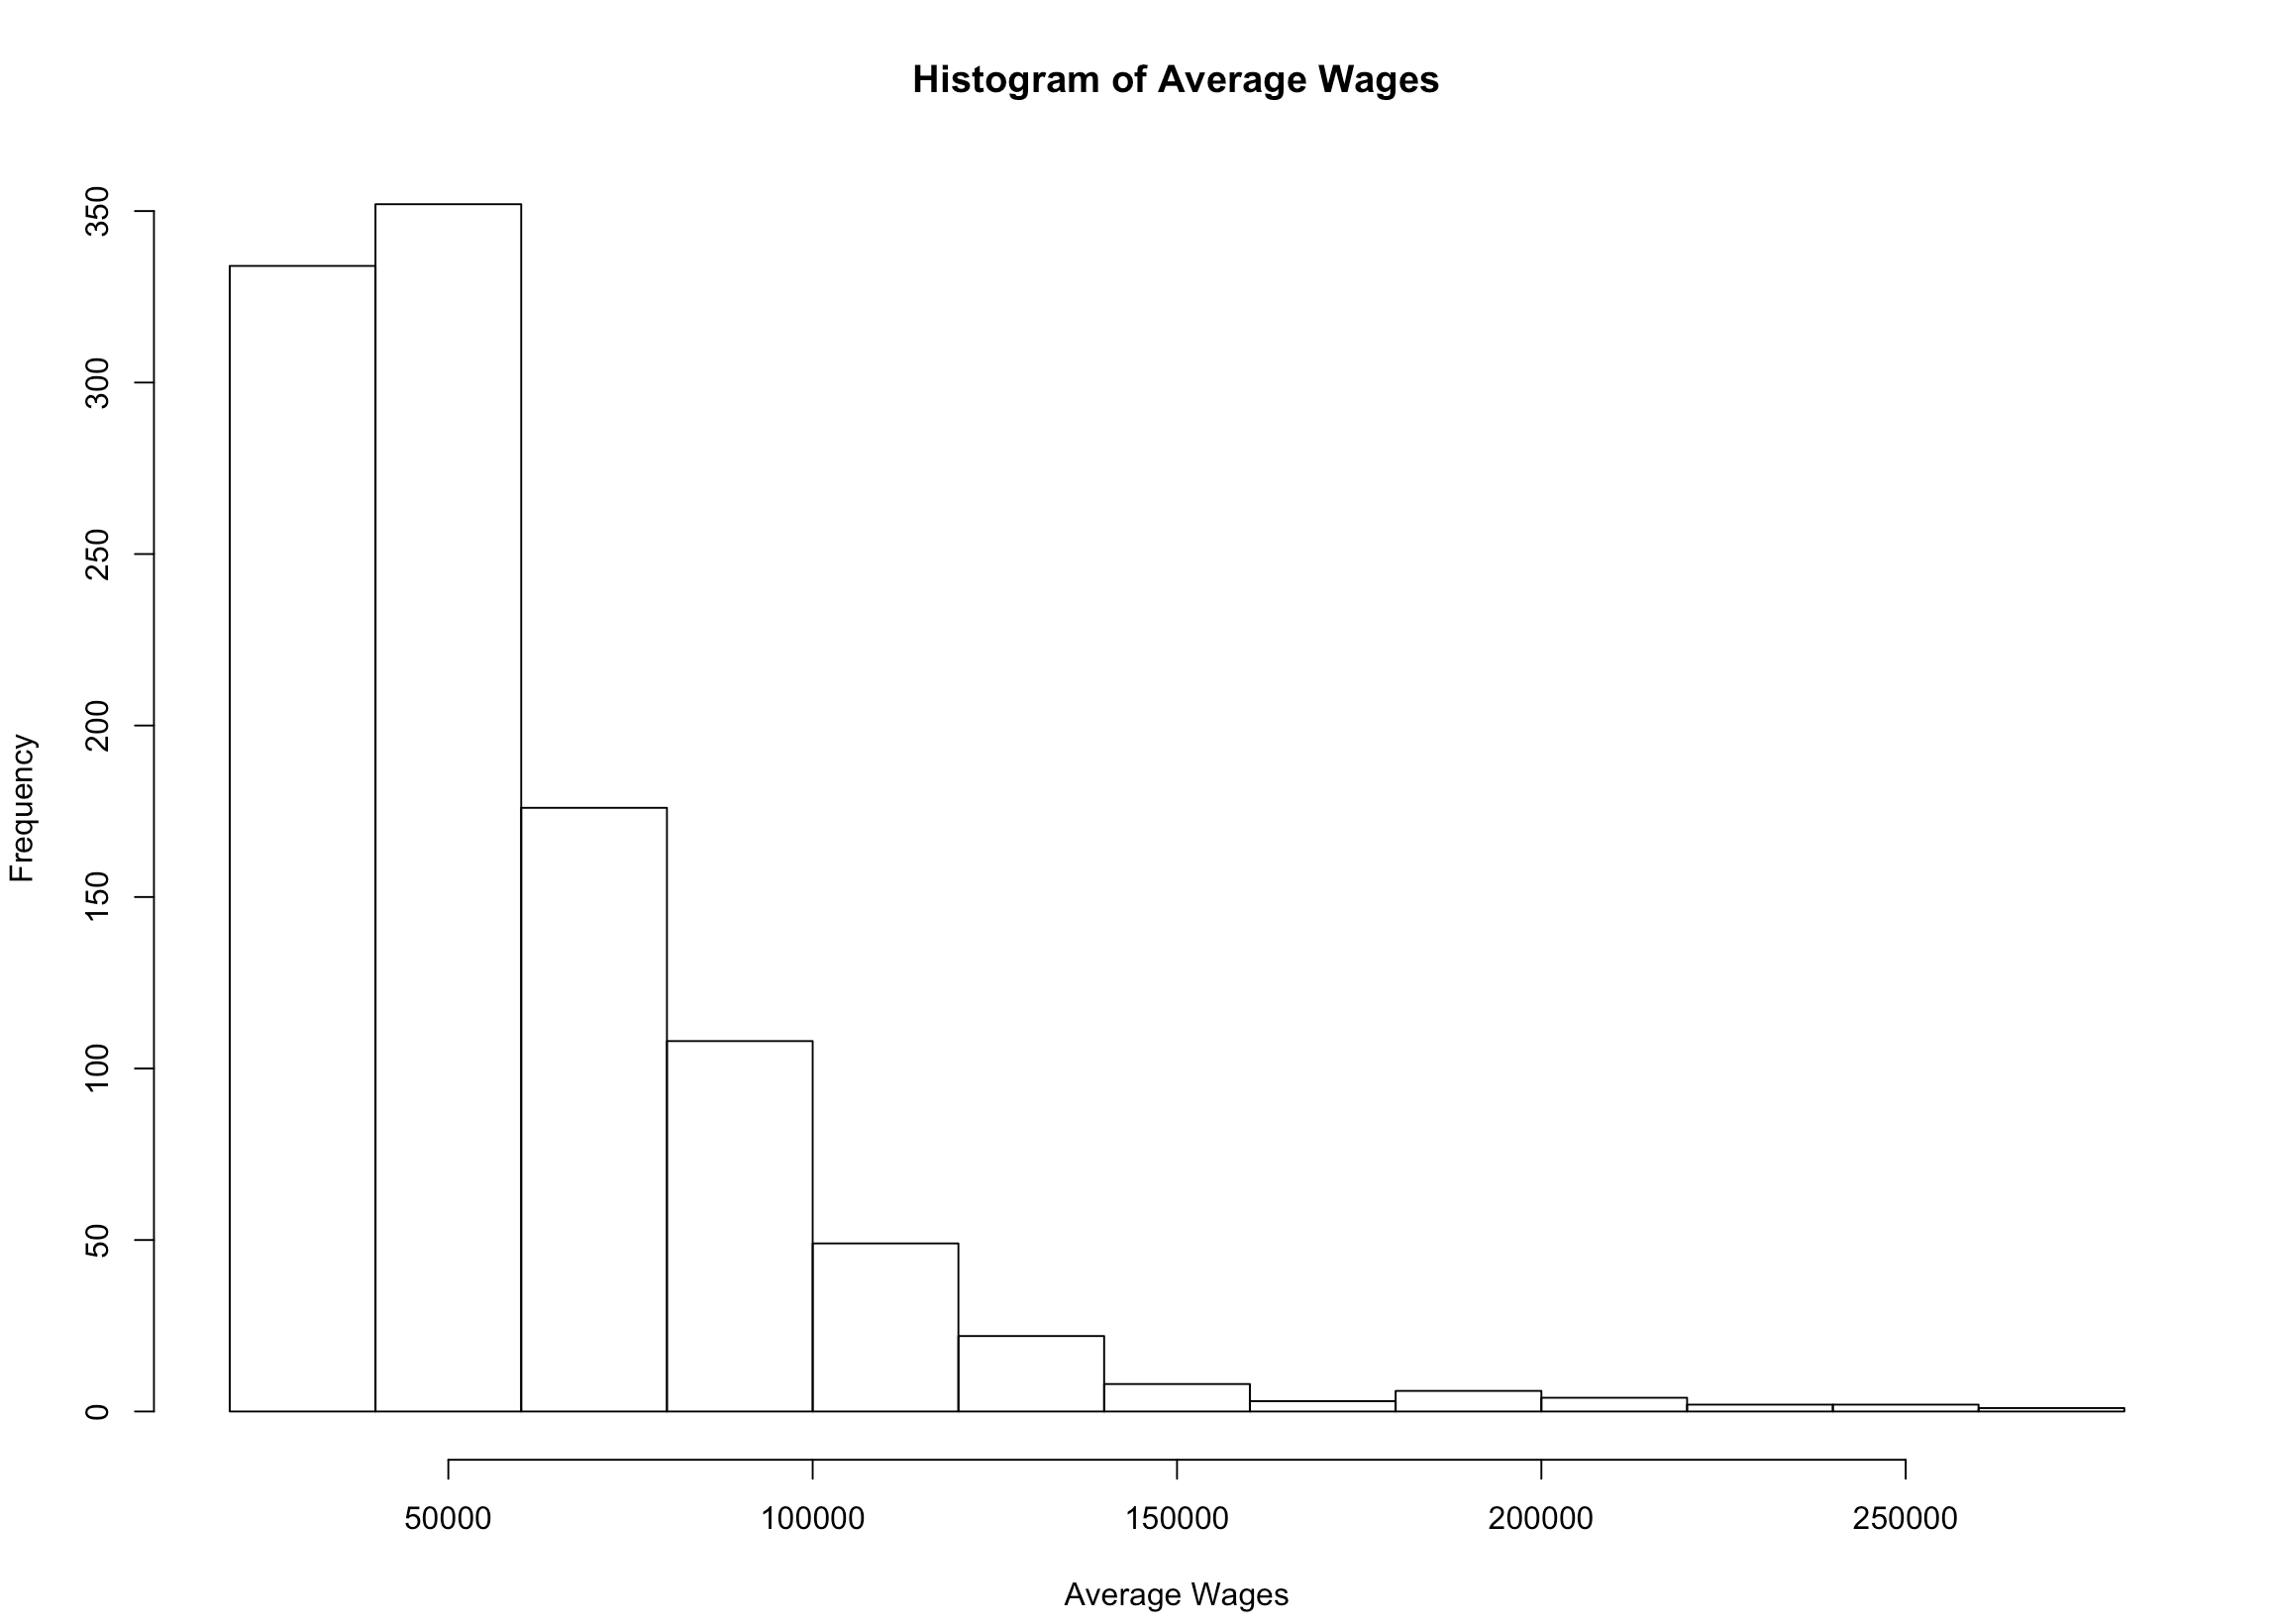
Suppose we consider the average employee to be at the median of $50,480 and the average benefit per employee to be roughly $18,000. We see how the typical (median) employer will be losing a rough estimate of 68-70 thousand dollars for every new employee hired then lost per year. Furthermore, the average individual born after the baby boom held around 10.8 jobs from age 18 to age 42. Making it more likely that people will change offices while employed at “your company”. Since it is so difficult to really know the marginal impact each employee has on their firm, you don’t necessarily know how much you are losing.
For this case, I built a tool that calculates a not so rough estimate of how much a single employee can cost you. (Note here: There are many many ways to calculate the cost of an employee. This will not be looking at the amount of time employees are costing by making mistakes or using another employees time or time off from work. In other words, vacation and inefficiencies.)
Our example here is rather simple. The true cost of an employee comprises of 3 things:
- Annual Employee Labor Cost (Salary + Bonuses)
- Annual Employee Overhead Cost (Overhead / # of employees)
- Annual Employee Tax (FUTA, SUTA, Social Security, Medicare)
The sum of these will amount to the total cost of an employee.
I am by no means an expert in accounting. I actually did rather terrible on an accounting class at my university. Yet, going through these and countless other scenarios have helped me gain a deeper understanding of the language of business.
Here is my R script with 4 functions that will allow you to input the necessary information to estimate the cost of your employee. I apologize if this isn’t very readable. It is in a particular documentation format just in case I want to create a package using roxygen2 . Please refer to the #’ marks to guide you on the function inputs.
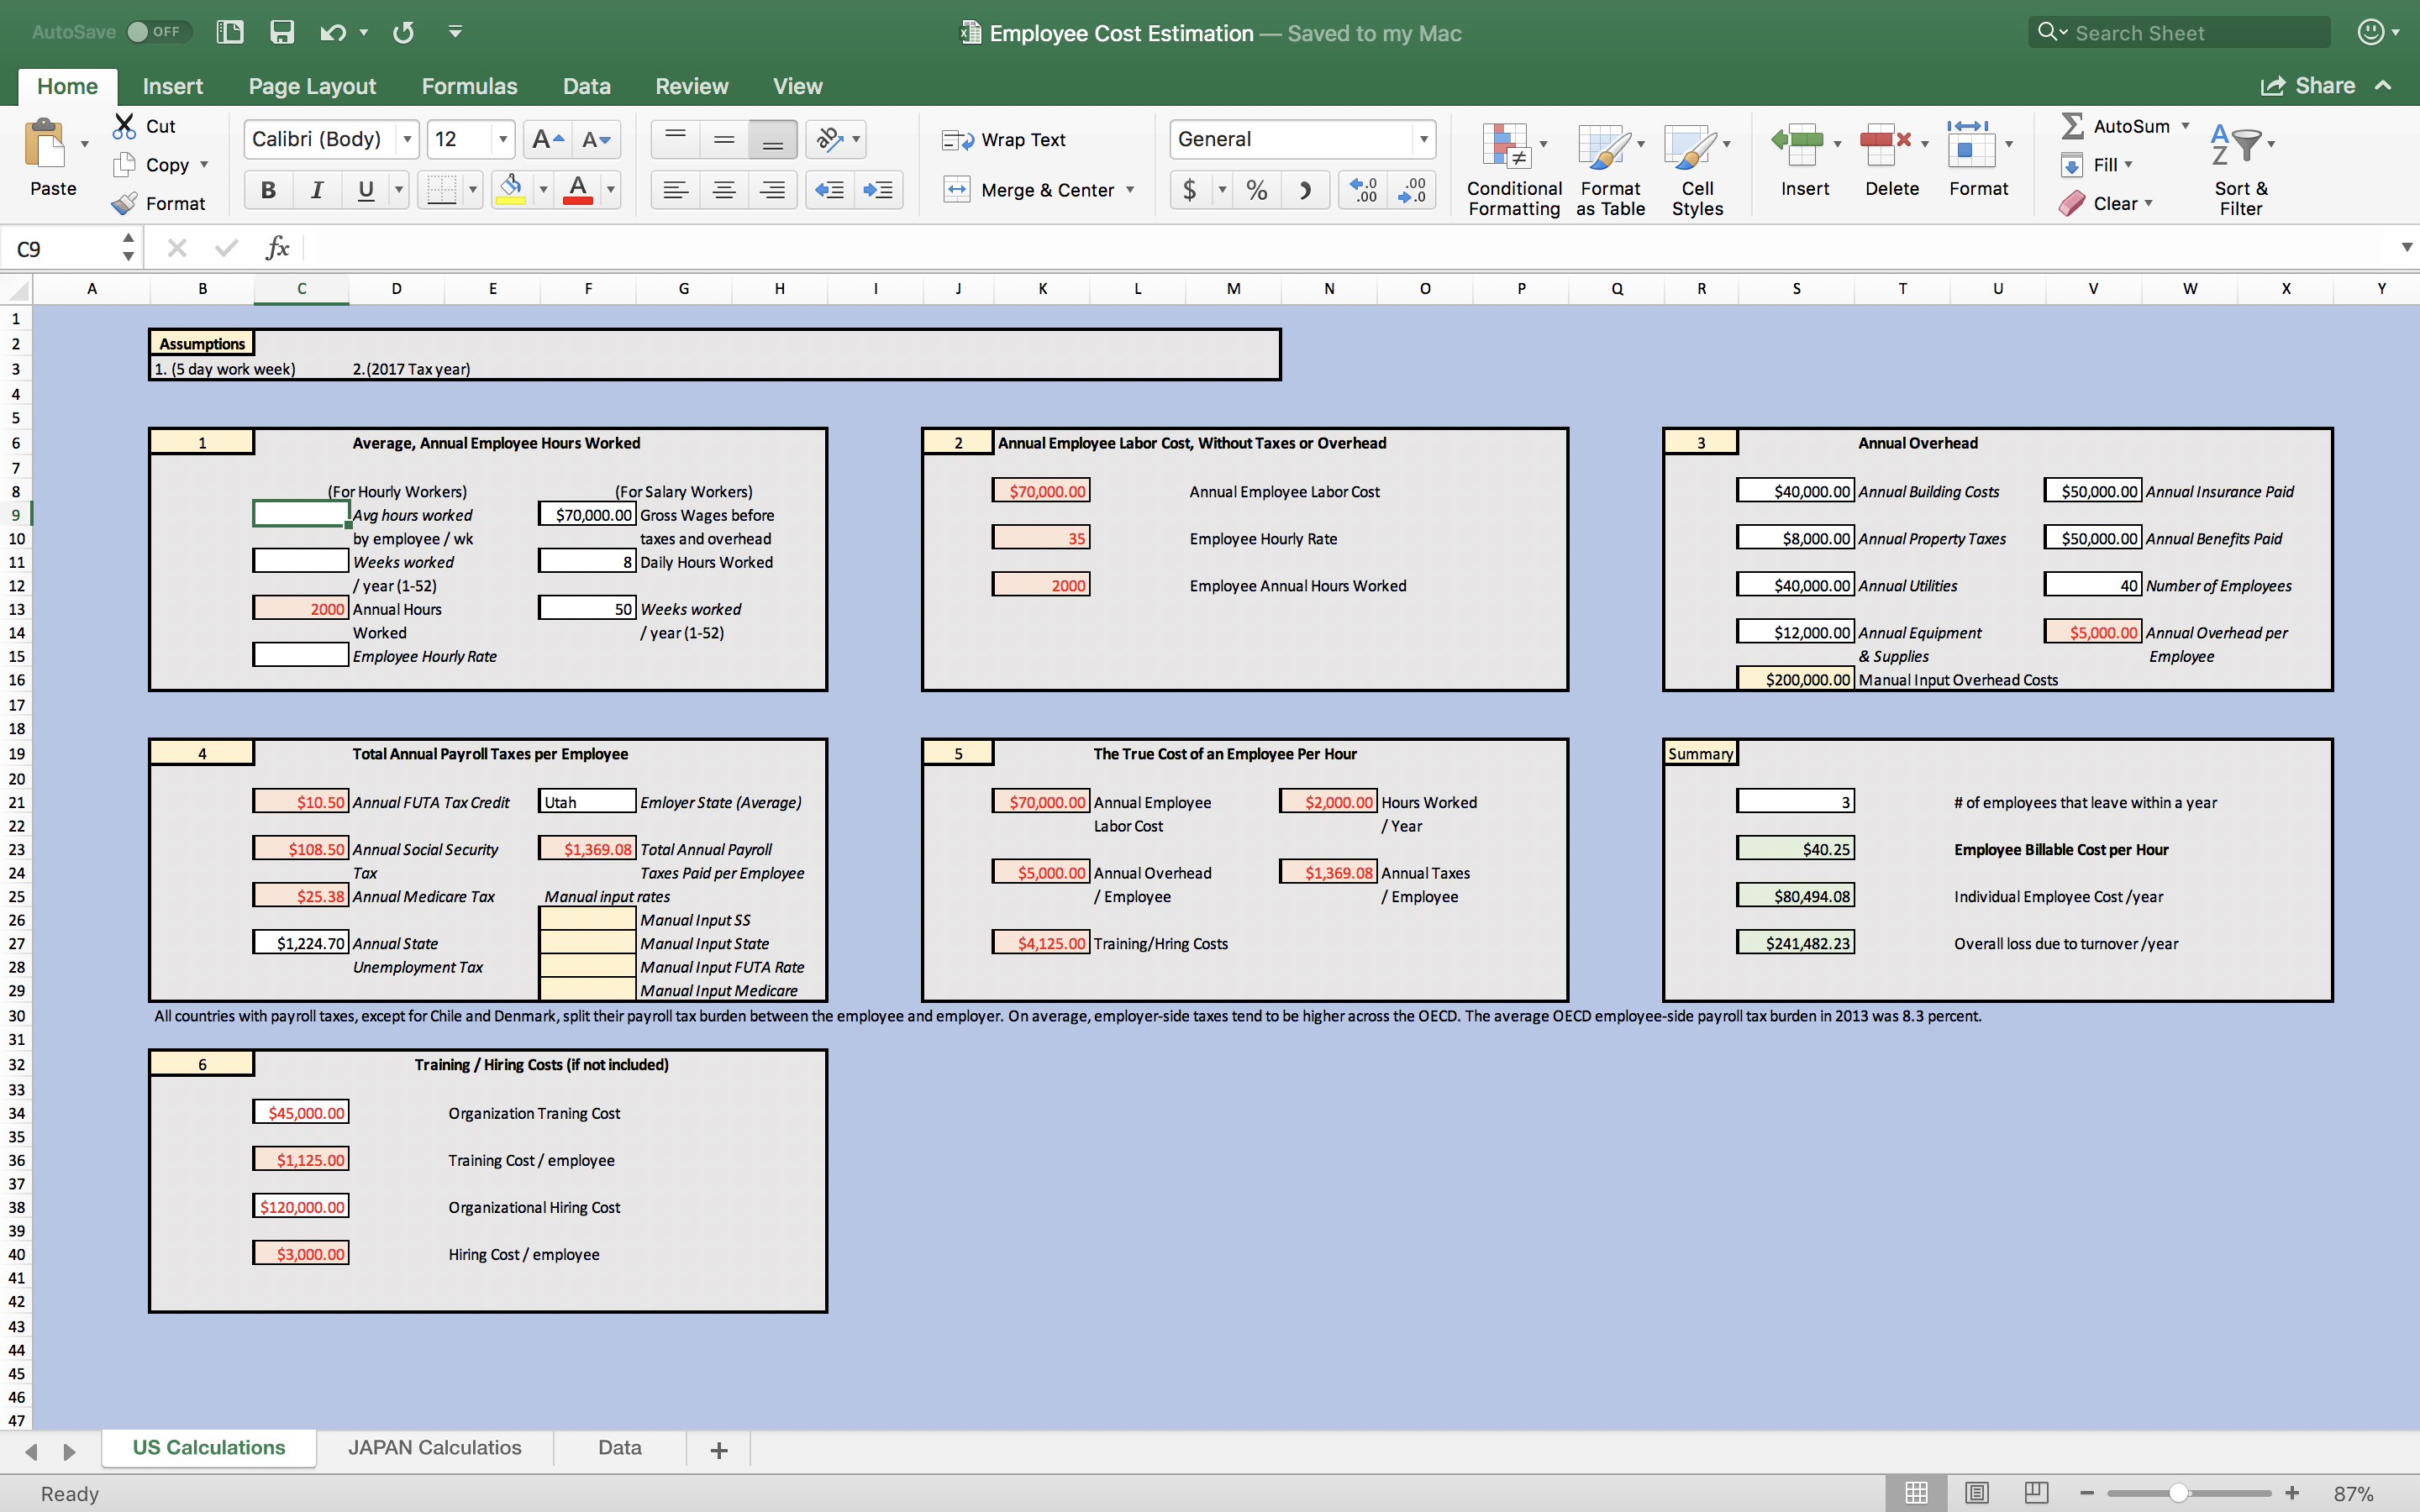
If you want to see it done in excel, you can download it here. It looks like this.
Otherwise, please source it by running this in your command line.
source("https://raw.githubusercontent.com/tykiww/projectpage/master/Tools/empcost.R")
Technically, what I created could be carved on the back of a paper napkin. Furthermore, this is a very basic situation. You’ll notice how simplified the math is. Thus, it is an estimation tool. Not all companies operate in this linear fashion, but for the most general case, it will work. Regardless, it would be a very useful tool for those that do not want to be math oriented or need quick solutions.
Let’s create a scenario where you are back in 2017 and you own a company in Arkansas. Your typical analyst makes around $70,000 a year including bonuses and no benefits. They are alloted 4 weeks of vacation out of which only 2 weeks are paid time off. Furthermore, they work a 6 day week.
You also have the following information.
- You are a $40 million company.
- Number of Employees in Office: 400 (95% Analysts)
- Total Annual Operating expenses (Not including Training and Hiring): $621,759
- Total Annual Training and Hiring costs: $500,800
- Your employees typically stay in office for around 8 hours. (N,sd ~0.65 (really just making this up.))
- Your turnover rate amongst the analysts has rose to 4% for the past 3 years.
How much do you end up paying for your typical employee per year?
Let’s begin first with finding a general labor cost estimate. We’ll include the 70,000 dollars and the 50 hour paid weeks. Assuming that all the employees stay about 8 hours per day working 6 days a week, we have the information we need to go to the next step.
emplabor <- function(ansalary = FALSE, wkpy = FALSE, dhw = FALSE, wage = FALSE, wdw = 5) {

  if (!ansalary) p <- 0
  else p <- 1

  if (p == 1) {
    hourwage <- ansalary / (wkpy * dhw * wdw)
    hoursperyear <- wkpy * dhw * wdw
    c("Annual Salary" = ansalary, "Hourly Wage" = hourwage,
      "Annual Hours Worked" = hoursperyear)
  } else if (p == 0) {
    hoursperyear <- wkpy * dhw * wdw
    ansal <- wage*hoursperyear
    c("Annual Salary" = ansal, "Hourly Wage" = wage,
      "Annual Hours Worked" = hoursperyear)
  }
}

# test
a <- emplabor(ansalary = 70000, wkpy = 50, dhw = 8, wdw = 6)
a
  ## Annual Salary         Hourly Wage Annual Hours Worked
  ##         70000               29.17                2400
Next, we will move on to grabbing our overhead costs. This is simple as we have our operating, training, and hiring costs all together. We will use the sover option to sum up the vector of 2.
empover <- function(tover = FALSE,count,sover=FALSE) {
  options(warn=-1) # warnings don't hurt the output. Just get in the way.
  if (sover == FALSE)  {
    overhead <- tover / count
  }
  else if (tover == FALSE) {
    overhead <- sum(sover) / count
  }
  options(warn=0)
  c("Overhead per employee" = overhead)
}

b <- empover(count = 400, sover = c(621759,500800))
b
## Overhead per employee
##              2806.40
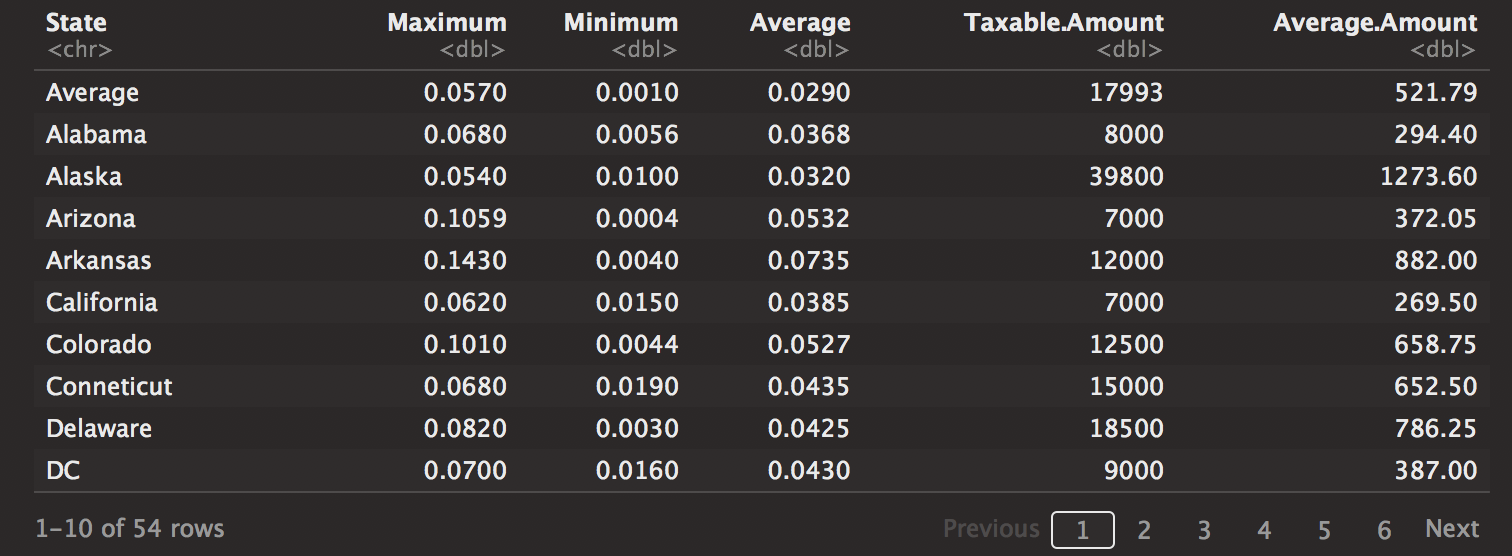
This next function is rather long, but it is mosly due to cleaning. I hope that I can find a more efficient way to clean the dataset, but for now I will manage with what I have. We have here the employee tax by state. All we do now is list the state, salary (which we pulled from before), number of employees and also take a look at the dataset from the repository.
emptax <- function(state,salary, count, taxes = FALSE, dataset = FALSE) {
  require(dplyr)
  # importing dataset.
  url <- "https://raw.githubusercontent.com/tykiww/projectpage/master/datasets/hr-cost/2017statetax.csv"
  setz <- read.csv(url, header = T)
  # Clean Set
  {
  setz <- setz[-1]
  setz$State <- as.character(setz$State)
  setz$Maximum <- (gsub("\\%","",setz$Maximum) %>% as.numeric) * .01
  setz$Minimum <- (gsub("\\%","",setz$Minimum) %>% as.numeric) * .01
  setz$Average <- (gsub("\\%","",setz$Average) %>% as.numeric) * .01
  setz$Taxable.Amount <- gsub("\\$","",setz$Taxable.Amount)
  setz$Taxable.Amount <- gsub(",","",setz$Taxable.Amount) %>% as.numeric
  setz$Average.Amount <- gsub("\\$","",setz$Average.Amount)
  setz$Average.Amount <- gsub(",","",setz$Average.Amount) %>% as.numeric
  }
  # Separate Tax
    # FUTA
    FUTA <- salary*0.6*.01/count
    # SUTA
    SUTA <- setz[setz$State %in% state,][6]
    names(SUTA) <- "SUTA"
    # Social Security
    SS <- salary*6.2*.01/count
    # Medicare
    MED <- salary*1.45*.01/count
  # New Tax Dataset
    dat <- t(cbind(FUTA,SUTA,SS,MED))
  # Output
    options(warn=-1)
  if (taxes == FALSE) {
    g <- sum(dat)
  } else {
    g <- sum(dat[rownames(dat) %in% taxes,])
  }
    options(warn=0)
  if (dataset == T) {
    list(setz,c("Employee Annual Tax" = g))
  } else {
    c("Employee Annual Tax" = g)
  }
}

c <- emptax("Arkansas",a[1], 400, dataset = TRUE)[[2]][1]
c
Our first output is the dataset. Then our estimate will include our employee annual tax.
## [[2]]
## Employee Annual Tax
##            896.4375
Finally, we will be combining all to create our overall employee cost. Our wages, overhead, annual tax, and hours comes from the past formulas. 4% of 380 employees is ~15. So we have what we need below.
empcost <- function(wage,overhead,antax,extras=FALSE,hours,leave) {
  require(dplyr)
  if (extras == FALSE) {
    indcost <- c(wage,overhead,antax) %>% sum
  } else {
    indcost <- c(wage,overhead,antax,extras) %>% sum
  }

  billable <- indcost/hours
  names(billable) <- c()
  loss <- indcost*leave
  list("True cost of employee"=indcost,
       "Employee billable cost/hour"=billable,
       "Overall estimated loss due to turnover"= loss)
}
400*.95*.04 # equals 15.2
empcost(a[1],b,c,hours =a[3],leave = 15)
## $`True cost of employee`
## [1] 73702.84
##
## $`Employee billable cost/hour`
## [1] 30.70951
##
## $`Overall estimated loss due to turnover`
## [1] 1105543
Our output gives us valuable information. First, is our “true cost” to our employee. We notice here how one employee costs about 105% of his annual salary. The employee taxes and overhead costs seem to be well managed. (This is not typical for an average company. Please assume variability amongst all companies, so put in your own information!!)
Next is our employee billable cost/hour. This shows the service fee we should be charging to our clients for the time they are spending with our employees. This may be useful for any lawyers or consultants who need to charge accurate hourly rates as to ensure no loss of profits.
Yet once we hit the estimated loss due to turnover, we see a problem. If you are expecting to re-hire 15 employees every year, our overall spending for all those analysts will amount to be over 1 million dollars. Now that seems to be a problem.
Any solutions? Probably some organizational changes seem necessary. Maybe your employees are burned out? Maybe they don’t have enough challenge demands. Adjustments will need to be made in order to invest more into decreasing turnover. You might know what to do better than I do. The strategic decision is now up to you!
Overall, we see another way to use R outside of a pure stats need. As long as we have these functions marked, they become easy access for business. If R still isn’t your thing, don’t worry. The excel tool is just as good. Any recruiting or HR based sales-consultant can use it to identify potential organizational costs and negotiate their leadership training products right beside their client. Of course, it should be customized more to fit their needs.
I hope this will incentivize you to be more anaytical in your every-day processes! Thank you for reading!